This post continues our exploration of inclusion, focusing on the third component of our inclusion index: the school placement of pupils with an Education, Health and Care Plan (EHCP). You can read a short summary of this article below.
Introduction
The placement score in our index is derived from two indicators:
- The percentage of EHCP pupils in state-funded special schools
- The percentage of EHCP pupils in non-maintained special schools or independent schools
LA areas with a smaller proportion of EHCP pupils in state special schools and a smaller proportion in independent schools are ranked as more inclusive. High numbers of EHCP pupils placed in state or independent special schools, or into other independent provision, suggests that mainstream schools are unable to support EHCP pupils’ needs and/or that these pupils feel out of place in mainstream schools. We include non-special independent schools as this gives a better measure of the proportion of EHCP pupils who are having to find alternatives to state-provided mainstream education which is often away from a young person’s local community.
Although there are, of course, some SEND pupils whose needs mean that they will benefit from specialist provision, as well as some children and parents who choose independent provision for other reasons, we believe that the majority of SEND pupils are best served by well resourced and inclusive SEND provision in mainstream schools. To enable this, schools must be properly resourced and have the required expertise to be able to provide a truly inclusive education to their SEND pupils. Our approach is consistent with recent research by London Councils that found that:
‘The most common definition of inclusion expressed by both local authorities and schools was “children with SEND being able to attend their local school.” [1]
Similarly, the Association of Directors of Children’s Services (ADCS) have called for:
‘Greater focus and attention on the benefits of an inclusive mainstream education. All but the most severe or complex needs should be met locally so children can stay within their local community, close to friends and family networks.’[2]
In this article we give a brief overview of the current landscape of placement scores across the country. We then explore how differences in the volume of special schools and deprivation levels impact SEND pupils’ school placement.
School placement across England
The interactive map below allows you to explore school placement data for each LA area in England. Hover over an LA area on the map to see its average placement data over the last three years. The overall placement score is calculated out of 100.
Figure 1- Interactive map of placement scores
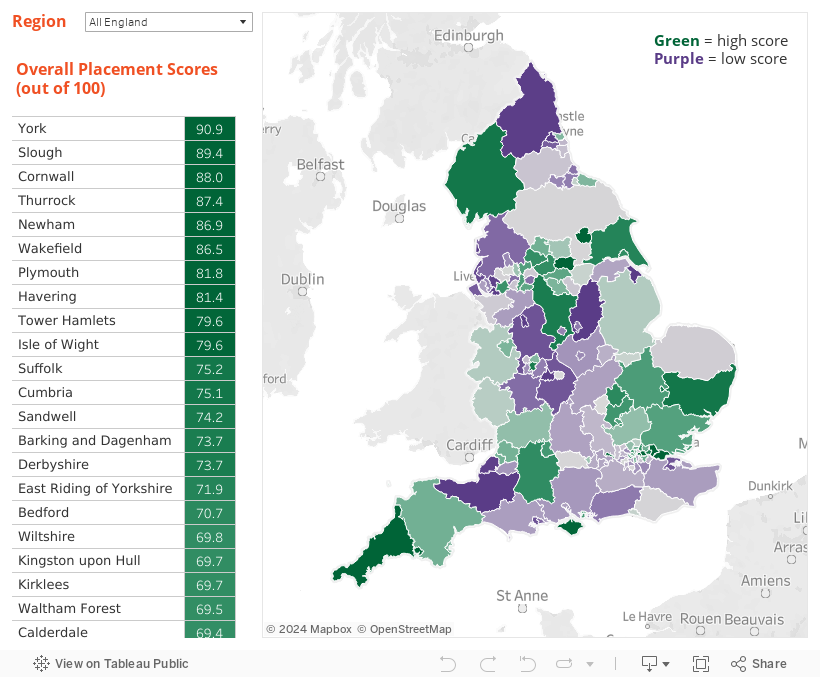
Figure 2- Placement score by region

The East of England is the region with the highest average placement score – i.e. the region where the lowest proportion of EHCP pupils are in state special schools and independent schools. The North East has the lowest average placement score. The North East’s low score is driven by the high proportion of EHCP pupils placed into state special schools, rather than having high numbers in independent schools.
While London (inner and outer) scores highly in our overall inclusion index, it scores slightly less well on our placement indicators. Inner London ranks 3rd out of the ten regions for placement score whilst outer London ranks 5th. The regions with the highest proportion of their EHCP cohort in independent or non-maintained special schools were inner and outer London. Interestingly, these two regions had the lowest proportion of its EHCP cohort in state special schools. This suggests that placement of EHCP pupils in special schools may be driven by the provision available locally rather than a policy decision.
Which LA areas have the highest and lowest placement scores?
The tables below present the placement scores and three year averages for the two underlying indicators for the lowest and highest scoring LA areas.
Figure 3- Highest scoring 10 LA areas for placement

Figure 4- Lowest scoring 10 LA areas for placement

There is a significant amount of variation between LA areas. The highest scoring LA area (York) has very few EHCP pupils in independent or non-maintained special schools (1.6%) and also has a relatively low proportion of EHCP pupils placed in state-funded special schools (26.3%). In contrast, the lowest scoring LA area (Blackpool), had 11.0% of its EHCP cohort in independent schools and 54.4% in state-funded special schools. Interestingly, some of the lowest scoring LA areas, like Newcastle upon Tyne and Nottinghamshire, had lower proportions of its EHCP cohort in independent or non-maintained schools but relatively high proportions in state special schools. Overall, LA areas vary from having under a third of EHCP pupils in special and independent/non-maintained schools to almost two thirds. This is clear evidence of inconsistent practice on the placement of EHCP pupils across the country.
We explored two explanations for this variation:
- Provision: How does the number of special schools in an area impact placement decisions?
- Deprivation: How does deprivation impact the school placement of SEND pupils?
1. Provision matters
Key finding: LA areas with more special schools tend to place a higher proportion of their EHCP cohort into special schools
The chart below shows the relationship between the numbers of special schools in an LA area and the proportion of EHCP pupils attending independent or non-maintained and state special schools. The size of each bubble reflects the 0-24 year old population of the LA area.
Figure 5 – Number of special schools per pupil against proportion studying in special schools

The fact the placement decisions depend on local provision is not a surprising finding, but it is important to understand. Using the latest data, we looked at the number of state special schools per pupil (using 0-24 year olds population for as a proxy for pupil numbers) and compared it to the percentage of EHCP pupils studying in special schools. We found that the more special schools relative to the numbers of young people, the higher the proportion of EHCP pupils studying in special or independent/non-maintained schools.
This suggests that decisions made about where to place EHCP students are partly driven by the availability of special school places. Therefore, the placement score in our overall inclusion index may be influenced by the geographical location of existing special schools. LA areas that have a larger number of special schools will tend to place a larger proportion of EHCP students in these schools and will therefore score lower on placement.
This is likely to be explained by a combination of two reasons. Firstly, having more local special schools makes it easier to place a pupil in a special school that is closer to their home. Secondly, it is possible that families with children with severe SEND, who will need to attend a special school, may choose to live close to a special school that they believe best serves their needs. LA areas with more special schools are therefore likely to attract more of these families.
This suggests that the geographical distribution of special schools may be skewing our inclusion index in favour of LA areas with lower numbers of special schools.
An interesting consequence of the location of special schools is that pupils with the most complex needs may travel across LA area borders to attend schools in other LA areas. This may impact outcomes in these LA areas. We did find that LA areas with higher numbers of state special schools tended to have more pupils from other LA areas attending these schools. The most extreme example of this was the Staffordshire LA area, where there are 23 state special schools, and 355 pupils (15.5% of special school pupils) travelling into the LA area from other areas to attend these schools. At the other end of the spectrum, the North Lincolnshire LA area has two state special schools, and only three pupils (1.1% of special school pupils) travelling into the LA from elsewhere to attend these schools.
2. How does deprivation impact placement?
We found two ways in which deprivation level impacts school placement. Deprivation influences both the choice between independent and state-funded special schools and the provision of both types of schools in an LA area. We used IDACI (income deprivation affecting children index) scores to measure deprivation. A higher score indicates a higher level of deprivation.
Key finding: More deprived areas tend to have a higher percentage of pupils in state-funded special schools and a lower percentage of EHCP pupils in independent schools.
Figure 6 – Deprivation and school placement

Figure 6 shows that LA areas with higher levels of deprivation tend to place a larger proportion of EHCP pupils in state special schools, but a lower proportion in independent sector provision. The size of each bubble reflects the 0-24 year old population of the LA area.
After splitting LAs into three deprivation bands, we found that the most deprived third of LAs have an average of 38.4% of their EHCP cohort in state special schools compared to 31.4% of EHCP pupils in the most affluent areas. The most deprived third of LA areas have an average of 5.4% of their EHCP cohort in independent or non-maintained special schools, compared to 7.0% in the most affluent areas.
Key finding: More deprived areas have fewer state-funded special schools and independent special schools
Deprivation may also have an impact on what provision exists in an LA area. More deprived areas tend to have fewer special schools (both state and independent). The most deprived third of LA areas have an average of 5.9 state-funded special schools per LA area, in contrast with an average of 7.4 state special schools in the most affluent LA areas. Similarly, the most deprived LA areas have an average of 0.2 non-maintained special schools per LA compared to 0.6 in more affluent LA areas.
This suggests that the lower rates of EHCP pupils in independent or non-maintained special schools in more deprived areas (as above) may be partly explained by the availability of provision but the higher proportions in state-funded special schools cannot be.
The variation of provision reinforces why it is better for EHCP students to be well served in mainstream education. If SEND pupils cannot be provided for in mainstream schools, they could face long journeys to special schools in other LA areas. Aside from the time cost, this risks pupils feeling detached from their local communities. It is also very expensive for councils to provide this transportation. This is particularly true for pupils in more deprived LA areas, which have lower levels of provision of special schools within the LA area. Although we argue that as many SEND pupils as possible should be kept in mainstream education, for those who are better served in special schools, this inequality of provision is a concern.
What does this mean for inclusion?
- Our placement scores suggest that the LA area an EHCP pupil lives in will impact whether they are kept in mainstream education
- Placement is influenced by provision. SEND pupils in areas with high levels of special school provision are more likely to be taken out of mainstream education
- Areas with higher levels of deprivation tend to have lower levels of special school provision. SEND pupils in areas of high deprivation may therefore face long travel to special schools in other LA areas.
In the our next inclusion series blog, we look at the attainment and progress of EHCP pupils.
Summary
- There is evidence of inconsistent decision making on school placement of EHCP pupils across different regions and LA areas
- Our inclusion index scores LA areas where a greater proportion of EHCP pupils are in special schools as less inclusive
- School placement is influenced by both the availability of provision and deprivation.
Whether a pupil is kept in mainstream state education or placed into specialist provision is clearly a critical decision for children and their parents. A more inclusive system would ensure better provision in mainstream education, reserving specialist education for those with the most complex needs.
——————————————————————————————————————————————————-
Data Sources
Placement
- https://www.gov.uk/government/statistics/statements-of-sen-and-ehc-plans-england-2019
- Section: Statements of SEN and EHC plans: England, 2019 – national and local authority tables
- Same data source used for 2019, 2018 and 2017
- Based on resident population
Deprivation
- https://www.gov.uk/government/statistics/english-indices-of-deprivation-2019
- Section: File 11: upper-tier local authority summaries
- Income Deprivation Among Children (IDACI)
- Based on resident population
Special schools
- https://www.gov.uk/government/collections/statistics-school-and-pupil-numbers
- Section: National statistics on school numbers / Local authority tables
- Based on school population
Population
- https://www.ons.gov.uk/peoplepopulationandcommunity/populationandmigration/populationestimates/datasets/populationestimatesforukenglandandwalesscotlandandnorthernireland
- Based on resident population
Footnotes
[1] London Councils. Inclusive Practice: Inclusion of children with SEND should be the default in all schools (October 2019)
[2] ADCS. ADCS response to the Department for Education’s call for evidence on provision for children and young people with special educational needs and disabilities, and for those who need alternative provision (July 2019)
Comments are closed.