This blog post explores the latest DfE data on special educational needs and disabilities (SEND) across England. This includes data on the primary needs of SEND pupils, which we look at by phase, and by geography. We also analyse the overall incidence of SEND, including the percentage of pupils with an Education, Health, and Care Plan (EHCP) and on SEN Support. Our interactive map below allows you to analyse SEND pupil incidence and need types across England. We further explore the possible link between pupils with English as an additional language, and those with a primary need of speech, language, and communication needs. Throughout the analysis below, we have calculated the numbers of pupils with each primary need as a percentage of all school pupils. This allows comparison across the country.
Headlines:
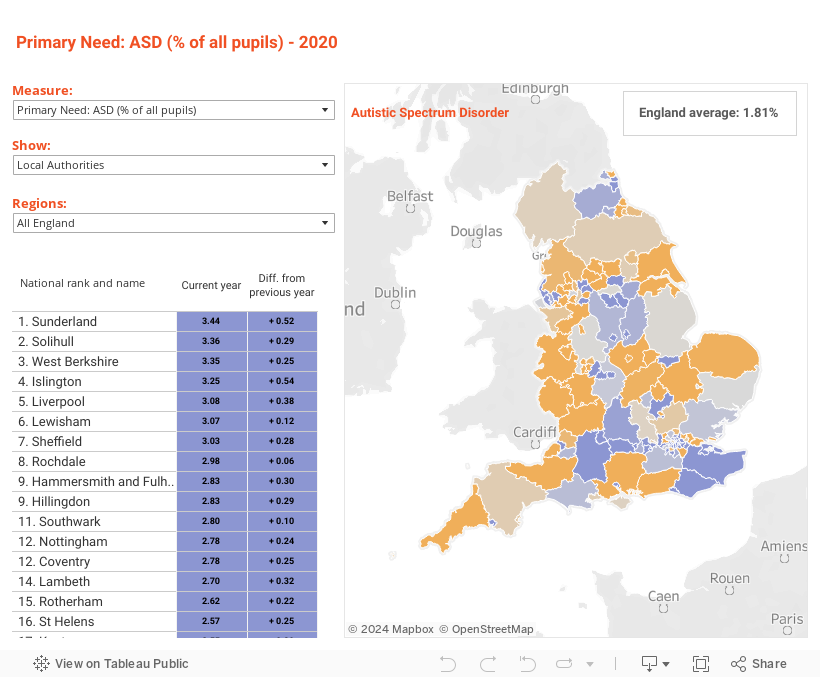
- The percentage of pupils across England who have autistic spectrum disorder (ASD) as their primary need and those with social, emotional and mental health (SEMH) needs have both increased, to 1.81% and 2.70% respectively
- 2.91% of pupils have a moderate learning difficulty (MLD) as their primary need, down from 3.02% in 2019
- London continues to have a much larger proportion of pupils with speech, language and communication needs (SLCN) than other regions
- SLCN is also a far more common primary need for pupils in primary school than those in secondary or special schools
- Conversely, specific learning difficulties (SpLD) like dyslexia are twice as common amongst pupils in secondary schools than primary
- Across England, the proportion of pupils with SEND has increased from 14.95% to 15.45% (12.14% with SEN Support and 3.32% with an EHCP). This has been driven by increases in both the percentage of pupils with an EHCP, and the percentage with SEN Support.
SEND pupil incidence and need type across England
Figure 1 – Interactive map of SEND incidence and need type by region and local authority
Key findings
Primary Need Types:
This analysis looks at the percentage of pupils with each primary need type across primary, secondary and special schools. Both pupils with an EHCP and those on SEN Support are assigned a primary need.
- The most common primary need type across England is SLCN, however there is large regional variation. While 4.47% of pupils in London have this primary need, this figure is only 2.38% of those in the East Midlands, and 2.63% in the East of England
- This variation is clear at a local authority level too, ranging from over 6% of pupils in five London local authorities, to 1.59% in Nottinghamshire. Seven of the 10 local authorities with the largest percentages of pupils with SLCN are in London
- The incidence of SpLD also has large variation across England, with one in every 22 pupils in Herefordshire having this primary need, compared to less than one in 100 pupils elsewhere
- There is similar variation in the proportion of pupils with ASD, ranging from over 3.44% of pupils in Sunderland, Solihull, and West Berkshire, to less than 1% elsewhere
- SEMH needs are most common for pupils in the South West, with four of 10 the local authorities with the largest proportion of pupils with SEMH in the South West. Five of the 10 LAs with the smallest percentages are in London.
Incidence of SEND:
- The proportion of all pupils with SEND (EHCP or SEN Support) ranges from around one in 10 pupils in some local authorities, to more than one in five in Blackpool and South Tyneside. Even within regions, the variation is similar
- Excluding the City of London, Newham has the smallest EHCP cohort, with 1.40% of all school pupils with an EHCP. Its neighbouring local authority, Tower Hamlets, has the largest EHCP cohort, at 5.06% of pupils
- There is a similar variation in the proportion of pupils with SEN Support, ranging from 7.50% in Havering, to 17.15% in Blackpool. Five of the 10 local authorities with the largest SEN Support cohorts are in the North West.
Regional differences – why are speech and language needs so common in London?
The table below shows the relative size of the SLCN cohort in each of England’s nine regions. London stands out as having a particularly large SLCN cohort, with 4.47% of all pupils having SLCN. The North East has the next largest SLCN cohort, at 3.46% of all pupils. Only 2.38% of pupils in the East Midlands have a primary need of SLCN, only just over half the figure in London.
Figure 2 – Percentage of school pupils with SLCN as their primary need (number of pupils with SLCN in brackets)

Are these, often large, differences in the makeup of regional SEND cohorts driven by differences in practices of assigning primary needs, are they the result of demographic differences, or is it something else entirely? Research for the DfE by the Better Communication Research Programme found evidence to suggest that having English as an additional language (EAL) can sometimes be conflated with having SLCN. They note that EAL pupils who had SLCN in primary school, were more likely to no longer have this primary need in secondary school.
“We think this implies some confusion about the needs of children who have EAL in primary school, some of which may have been categorised as having SLCN when their primary need related to the fact that they have EAL.”
If having EAL is being mistakenly characterised as having SLCN, that would help to explain why London has a much higher incidence of SLCN than other regions. In London, 41% of all school pupils have EAL, more than double the next largest regional proportion (West Midlands). The graph below supports this theory, showing that London local authorities do tend to have larger EAL and larger SLCN cohorts than those outside London. It also shows a general trend that local authorities with larger EAL cohorts have a larger proportion of pupils with SLCN as their primary need. For example, Tower Hamlets has the 2nd highest proportion of pupils with EAL in England and the highest proportion with SLCN. However, there are notable outliers, like Wolverhampton where almost 30% of pupils have EAL but there is a relatively small SLCN cohort, and Blackpool, which has a large SLCN cohort, despite having a relatively small percentage of pupils with EAL.
Figure 3 – Correlation between SLCN and EAL

This is just one of many possible factors that could explain the regional variations identified above, and further research is needed to better understand the key drivers.
Primary need type by school phase
Finally, we’ve looked at the primary need of pupils by their school phase. This reveals clear differences between the types of needs being identified in primary school pupils compared to secondary pupils.
Figure 4 – The percentage of pupils with each primary need by school phase

SLCN is the most common need type of pupils in primary school, accounting for one in every 22 pupils. This falls to just one in every 67 secondary school pupils. On the other hand, only 1.38% of pupils have a primary need of SpLD in primary school, compared to 2.58% of those in secondary school. This category includes specific difficulties, such as dyslexia and dyspraxia.
The percentage of pupils with a primary need of ASD or a severe learning difficulty (SLD) is lower in both primary and secondary than the all pupil figure. This is due to the number of pupils in special schools with these primary needs. In fact, fewer than one in every 1000 pupils in primary and secondary schools have SLD as their primary need, while this figure is around one in five in special schools.
Comments are closed.